
Mobile data usage chart: MB per hour for 24 travel activities
The lab's reference chart. Every row says where its number comes from: a vendor's published figure, a published bitrate we converted, or a labelled planning range you should check against your own phone.
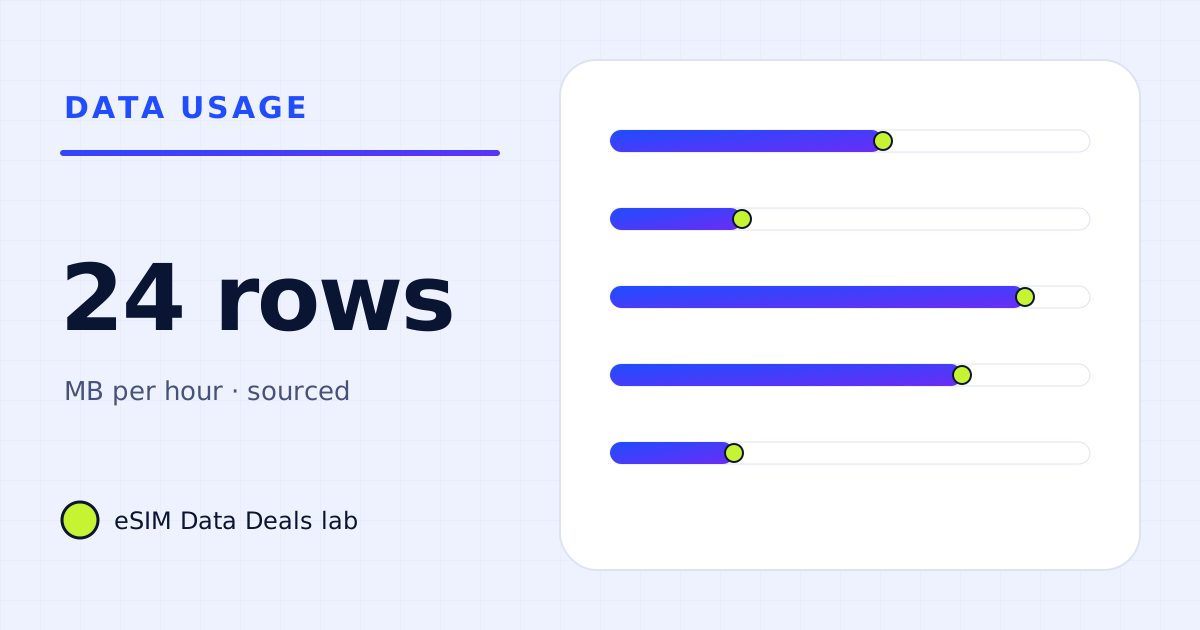
Per hour, navigation uses about 5–10 MB, messaging and email a few MB to about 100 MB, music 11–144 MB, app voice calls 54–72 MB, video-heavy social feeds 170–700 MB, video calls 0.54–2 GB and video streaming from about 170 MB (Netflix Save Data) to 3 GB (Netflix HD). Video is the dividing line.
- Navigation
- ≈ 5–10 MB/h
- Music
- ≈ 11–144 MB/h
- Voice call (app)
- ≈ 54–72 MB/h
- Social video feeds
- ≈ 0.17–0.7 GB/h
- Video calls
- ≈ 0.54–2 GB/h
- Video streaming
- ≈ 0.17–3 GB/h (HD)
- Conversion
- kbit/s × 0.45 = MB/h
On this page
What does each activity use per hour?
The chart puts all 24 activities on one log scale, so that 5 MB and 3 GB fit on the same page. Each step on the axis is ten times the one before. The table below it gives the exact figure, the source, and the evidence level: L1 published by the vendor, L2 converted from a published bitrate, L3 a labelled planning range.
| Activity | Per hour | Source | Level |
|---|---|---|---|
| Navigation (TripoSIM help) | 5 MB – 10 MB | TripoSIM help centre | L1 |
| Messaging, text only | 1 MB – 5 MB | planning range | L3 |
| Email, no big attachments | 5 MB – 30 MB | planning range | L3 |
| Ride-hailing app in use | 3 MB – 20 MB | planning range | L3 |
| Spotify Low (24 kbit/s) | ≈ 11 MB | Spotify bitrate × 0.45 | L2 |
| Messaging with photos, voice notes | 20 MB – 100 MB | planning range | L3 |
| Web browsing | 30 MB – 120 MB | planning range | L3 |
| Spotify Normal, podcasts (96 kbit/s) | ≈ 43 MB | Spotify bitrate × 0.45 | L2 |
| App voice call (Zoom audio) | 54 MB – 72 MB | Zoom 60–80 kbit/s each way × 0.45 | L2 |
| Spotify High (160 kbit/s) | ≈ 72 MB | Spotify bitrate × 0.45 | L2 |
| Spotify Very high (320 kbit/s) | ≈ 144 MB | Spotify bitrate × 0.45 | L2 |
| Netflix mobile Save Data | ≈ 167 MB | Netflix: about 6 h per GB | L1 |
| Social feeds with autoplay video | 170 MB – 700 MB | planning range | L3 |
| Laptop on hotspot, light work | 200 MB – 600 MB | planning range | L3 |
| Netflix mobile Automatic | ≈ 250 MB | Netflix: about 4 h per GB | L1 |
| Netflix Low | ≈ 300 MB | Netflix: up to 0.3 GB/h | L1 |
| YouTube 480p (ceiling) | ≈ 495 MB | YouTube 1.1 Mbit/s × 0.45 | L2 |
| Zoom 1:1 video, high quality | ≈ 540 MB | Zoom 600 kbit/s each way × 0.45 | L2 |
| Netflix Medium | ≈ 700 MB | Netflix: up to 0.7 GB/h | L1 |
| Zoom 1:1 video, 720p | ≈ 1.08 GB | Zoom 1.2 Mbit/s each way × 0.45 | L2 |
| YouTube 720p (ceiling) | ≈ 1.125 GB | YouTube 2.5 Mbit/s × 0.45 | L2 |
| Zoom group video, 720p | ≈ 1.98 GB | Zoom group bandwidth × 0.45 | L2 |
| YouTube 1080p (ceiling) | ≈ 2.25 GB | YouTube 5 Mbit/s × 0.45 | L2 |
| Netflix HD | 1 GB – 3 GB | Netflix: up to 3 GB/h | L1 |
How do the activities group?
Three bands cover almost everything a traveller does:
- Megabytes per hour (under about 150 MB): navigation, messaging, email, browsing, ride-hailing, music, podcasts and app voice calls. You can do a lot of these on a small plan.
- Hundreds of MB per hour: social feeds with autoplay video, low-quality streaming (Netflix Save Data, Automatic, Low; YouTube up to 480p), a 1:1 video call at standard quality, a laptop doing light work.
- Gigabytes per hour: HD video, 720p and group video calls, and anything a laptop does at full quality.
Plan sizing is mostly a question of how many hours you spend in the second and third bands.
What about things that are counted per item, not per hour?
| Item | Data | Where to check |
|---|---|---|
| Photo shared or backed up | ≈ 2–5 MB each (planning range) | Messaging apps often compress; cloud backups send the original |
| Video recorded on the phone, uploaded in original quality | tens of MB per minute at 1080p, more at 4K | iPhone shows the size per minute under Settings → Camera → Record Video |
| App update | the size shown in the app store | App Store or Play Store listing |
| Offline map area | shown before download | Google Maps or Apple Maps offline maps screen |
| Offline language for translation | small, shown in the app | Google Translate downloaded languages |
| Downloaded episode or film | depends on the quality chosen | Download quality setting in the streaming app |
The per-item list is where surprise data comes from. One forgotten photo-library backup, or a batch of app updates on arrival, can use more than a day of everything in the per-hour chart.
How do I use the chart for a trip?
- Pick your top three rows. The activities you will do most on mobile data, not on Wi-Fi.
- Estimate hours per day for each. Be honest about feeds and video; they are easy to underestimate.
- Multiply and add. Hours × rate for each row, then add a small allowance for maps, messages and email.
- Multiply by days and add 15–20%. That is the plan size to look for.
The data needs calculator does these four steps for you, and adds a daily-cap check.
Why not one number per activity?
Because one number would be false precision. The same hour of Instagram can be 150 MB or 700 MB depending on how many videos play and at what quality. The same Zoom call doubles between high quality and 720p. Even published figures are maximums: Netflix's "up to 3 GB an hour" for HD is a ceiling, and a slow drama can come in under it. Where a vendor publishes a figure, we use it. Where it doesn't, we give a range wide enough to be honest and tell you how to measure your own.
How do I check a row against my own phone?
Reset the counter, use the app for 15 minutes on mobile data, read the counter again and multiply by four. On iPhone the per-app list is in Settings → Cellular with Reset Statistics at the bottom; on a Pixel it is Settings → Network & internet → SIMs → App data usage. If your number is very different from ours, use yours: it already includes your settings, your screen and your habits.
Does the network change these numbers?
For fixed files, no: a 50 MB update is 50 MB on 4G or 5G. For adaptive video, yes: on a fast connection, apps on automatic quality step up, and Apple notes that the Allow More Data on 5G setting lets apps use more cellular data for higher-quality video. That is why the 5G guide recommends Standard or Low Data Mode for the travel line.
Frequently asked questions
Which activity uses the most mobile data?
Video. HD streaming (Netflix up to 3 GB an hour, 4K up to 7 GB) and group video calls (about 2 GB an hour at 720p on Zoom) are at the top. Everything below video is measured in megabytes.
Why are some rows ranges and others single numbers?
Single numbers come from a vendor's own figure or bitrate. Ranges are planning assumptions where no vendor publishes a figure (social feeds, browsing, messaging), so we give a wide range and say so.
Can I use this chart for a laptop?
Only as a floor. A laptop on a hotspot often gets higher-quality video and runs updates and sync in the background. The laptop row is a planning range for light work, excluding calls and updates.
How do I convert a speed into data?
Multiply kbit/s by 0.45 to get MB per hour, or Mbit/s by 0.45 to get GB per hour. For two-way traffic like video calls, add the upload and download rates first.
Got your number? Match it to a plan
On TripoSIM, choose your destination and compare total GB, validity, any daily full-speed amount and the Hotspot badge on each plan card.
We take data figures from the app makers' own help pages where they publish one, convert published bitrates with kbit/s × 0.45 = MB per hour, and label every planning assumption. We don't run paid reviews or publish prices. Editorial policy · How we get our figures · Who owns this site
Sources and how we checked
- Netflix Help Center: How to control how much data Netflix uses
- Spotify Support: Audio quality
- Zoom Support: system requirements and bandwidth
- YouTube Help: system requirements and recommended speeds
- Apple Support: Use 5G with your iPhone
- TripoSIM help centre (FAQ)
Figures were read from these pages on 7 November 2026. Apps change their settings and rates; if a number here disagrees with the app on your phone, trust your phone's own data counter. See how we get our figures.
Related reads
What does 1 GB of data actually get you? Hours by app, then 5 and 10 GB
1 GB is 100+ hours of navigation, 23 hours of Spotify Normal, 6 hours of Netflix Save Data or under 2 hours of a Zoom video call. Tables for 1, 5, 10 GB.
Read the guide →How we get our figures
Open →
How much data does streaming video use per hour?
How much data an hour of Netflix or YouTube uses at each quality setting, what the published figures mean on a phone, and how to cut it on a travel eSIM.
Read the guide →
How much data does WhatsApp use per day abroad?
WhatsApp text barely registers; photos, auto-downloaded videos and calls decide your day. Example days, the settings that matter, and how to measure.
Read the guide →